 Back to Archive
Metrics for H@H Client
A tutorial for monitoring your client using Telegraf and Grafana
By dekarrin
This tutorial is a step-by-step process for the setup of a system for monitoring the Hentai@Home client using graphs and automated alerts. It uses the Grafana web application to show charts of the client's performance and hath generation, Telegraf to both collect information from the host machines of the H@H clients as well as to collect information on the Hath network performance from the main Hentai@Home website, and InfluxDB as the metric storage backend. DigitalOcean is used to host these services on a server separate from the H@H clients in order to provide constant monitoring even during client downtime.
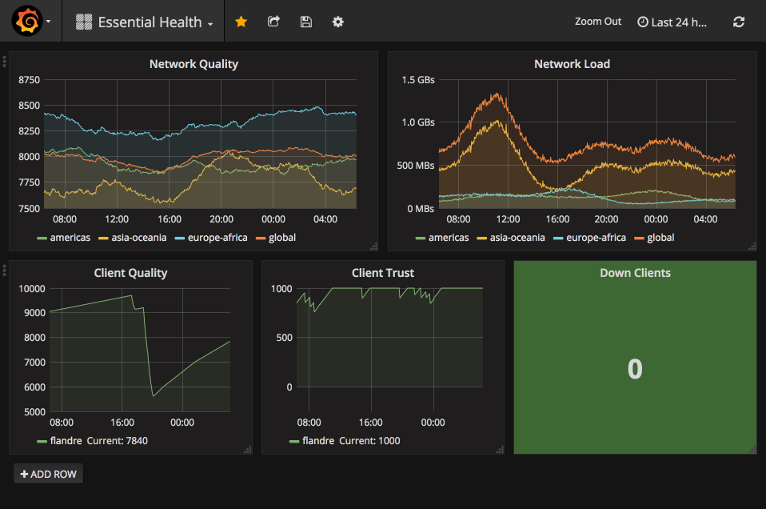
An example of one of the charts that this tutorial will help to set up.
This tutorial is split into several sections. I recommend going through each section in order; it might be possible to do the sections out of order, but it could result in parts of the metrics pipeline being unstable until the rest of the sections are completed.
Table of Contents
- Requirements
- Creating the Metrics Server
- Basic Server Setup
- Setting up InfluxDB
- Setting up Telegraf on the Clients
- Setting up Telegraf on the Metrics Server
- Setting up Grafana
- Where to go from Here
Requirements
There are a few things that you will need in order to set up the metrics stack. You are of course free to substitute the requirements as you see fit, but this is the system that works for me. If you do end up finding different ways to do things, please let me know and I would be happy to include it in this document.
Here is what you will need (all prices given are in United States Dollar):
- At least one Hentai@Home client that is already running and is actively contributing to the hath network. This guide will not be very helpful if you don't already have a running client; go to the H@H info page for info on running a client. Actually setting up the client is beyond the scope of this guide; please refer to the link and/or contact Tenboro on the forums for help with the actual set up and administration of the client.
- At least one web-accessible server that you have full root access on, or about $5/month to buy one from DigitalOcean, preferably completely separate from the Hentai@Home host machine. This box will be used to host the data storage backend InfluxDB as well as the chart and graph front-end, Grafana.
- A domain name, or about $10 to $30 per year to buy one (price depends on the TLD/ending). It will make your life far easier, especially when setting up proper HTTPS certificates for your Grafana application.
Creating the Metrics Server
You will need a place for Grafana, InfluxDB, and the hath network metrics collection daemon to live. I recommend that this be separate from any box that is hosting a H@H client, because if it isn't and that box goes down, you will get zero notifications that your client went down. For the same reason, it's a good idea to have it hosted on a different network than the one that your H@H clients are on.
You will need a server that is connected to the internet and that you have full root access on. Additionally, you will probably want a server with reliable uptime. You do not need a very beefy machine; I've found that a box with 512MB of RAM and 20GB of disk space is perfectly sufficient for my current needs.
The quick and easy ways to get a server with good uptime that you don't have to worry about maintaining yourself are to get an instance on an Infrastructure-as-a-Service system or to get a Virtual Private Server. VPSs tend to be a little on the slower side at smaller scale, do not often offer easy scaling options (not that this is a concern here), but most importantly do not usually give you full root access to the machine; for those reasons, I recommend getting an instance from an IaaS platform.
Create an Instance on Digital Ocean
This section of the guide walks through the steps required to set up an instance on DigitalOcean to use as the metrics server. If you already have a machine that meets the requirements for a metrics server, feel free to skip this step and continue with Create Domain Name Records.
DigitalOcean is an IaaS platform that offers excellent prices for small-scale VMs. They call their instances "droplets", and they offer a variety of different types depending on what your needs are. For the purposes of this guide, the smallest standard droplet they offer is perfectly sufficient. It costs only $5 per month at the time of this writing.
First, head over to DigitalOcean and create an account. You will need to enter credit card information so that you can be billed for you instance, but generally with IaaS platforms, you will not be charged until the billing period has ended.
The way you will be setting up the server infrastructure, it is extremely unlikely that you will be charged anything above $5 per month, but as with other IaaS platforms, you are billed based on usage, so it might be a good to set up a "Billing Alert" on the off-chance that something is inadvertently changed which causes you to be billed more than you would like. I set my alert to ping me if my bill ever exceeds $10 to be on the safe side. To configure this, head over to your account settings, go under "Billing", and scroll down to "Billing Alerts" to set a threshold for you to be warned at. Don't forget to save!
Okay cool, now let's actually create an instance. Hit the green Create button at the top right corner of the page and select "Droplets" (or just go to https://cloud.digitalocean.com/droplets/new).
You will need to select an operating system. The rest of this guide assumes that you are using Ubuntu, but you can select a different distro if you are more familiar with it and prefer it (though you will need to know how to translate the rest of this guide into the dialect of that distro). In addition, the metrics collection daemon is currently only optimized for installation on systems that use systemd (such as Debian/Ubuntu), so keep that in mind as well. Just make sure to select a Linux distribution (note that BSD is not the same as Linux!), or you are on your own for the rest of the guide.
Next, choose a droplet size. The smallest profile under "Standard Droplets" will work just fine; at the time of this writing that is a 1GB RAM/1 CPU/25GB Disk Space/1 TB Transfer image that costs $5 per month. If you really would prefer to have a beefier box, go for it, but it will cost you more.
Block Storage / Volumes are only necessary if you find you need more space on your droplet, but will cost you more. You really don't need it; 25 GB is fine to start with and you can always add volumes to your instance later.
For the data center, pick whatever you want. At the the scale that you are dealing with here it really doesn't matter. If I had to make a recommendation, I'd say pick a location that is closest to you for general use, as it might be miniscule fractions of a second faster. All of the data centers are just fine, though note that some features (such as block storage) are limited to particular data centers.
For "additional options", check whatever makes sense to you. I have my box set up with IPv6 and Monitoring. It's also a good idea to add weekly Backups. This will cause your bill to be a little higher (20% higher as of the time of this writing), but it is well worth it to ensure your data is not lost in the event of catastrophic system failure.
Setting up an SSH key during droplet set up is not a requirement, but it will make it so that the initial root password does not have to be sent to you over email. If you aren't already familiar with using SSH keys to authenticate to remote servers, don't worry about it, though I recommend you get familiar with them at some point as they will make your dev-ops life easier.
Finally, choose a hostname for your droplet. This is a name for your droplet, and if you want, you can stay with the default name which is based on the droplet profile, but I find it makes it much easier to give it a more meaningful name. Many admins give the hosts names based on the application running on the server; I give my hosts names based on anime characters. For my server infrastructure, I use Touhou characters such as flandre or patchouli. No matter what, in order to make your life easier, make sure to use only lower-case characters and dashes; this will also make it so your domain names can be the same as your hostnames. For the purposes of this tutorial, this guide will use the hostname meiling.
Finally, hit "Create", give the box a few moments to spin up, and you are done! You should now have an internet-accessible droplet with a static IPv4 address (and a static IPv6 address if you had selected it).
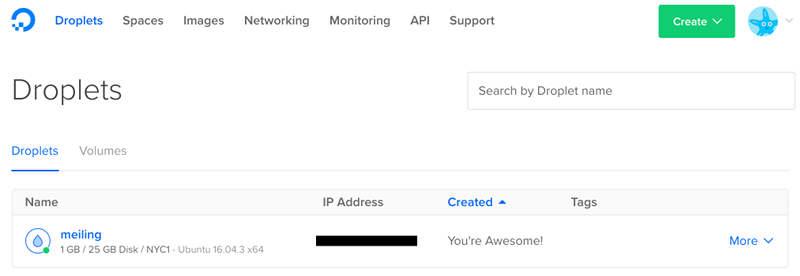
List of droplets. When you've created yours, it will be in this list.
Before you log in for the first time, you'll secure the droplet by setting up a cloud firewall, and you will set up a domain name for the host and put it on a subdomain so you can access it via name instead of via IP address.
Lock Down Instance with Firewall/Security Group
On DigitalOcean, new droplets are open to the internet on all ports. This is not the greatest idea; you will want to close all ports that are not necessary for operation. To do this, you will create a "Cloud Firewall" (also known as a "Security Group" on some IaaS platforms).
Go to the "Networking" tab on DigitalOcean, and select the "Firewalls" sub-tab. Hit the "Create Firewall" button and call it something meaningful; something like Influx-Grafana-HathTele will work just fine.
For Inbound Rules, first make sure that there is a rule for SSH over TCP for All IPv4 and All IPv6. If you do not, you will not be able to log in to your instance over SSH.
Add an inbound rule for HTTP and a rule for HTTPS; the fields should auto-populate, but make sure both rules contain the sources "All IPv4" and "All IPv6". This will allow Grafana to be accessed over the web, and it will allow Certbot to do automatic TLS certificate renewal.
Also add a "Custom"-type inbound rule for TCP traffic under port 8086, again making sure it contains the sources "All IPv4" and "All IPv6". This will make InfluxDB accessible over the web.
The default outbound rules should be fine. Make sure that ICMP, All TCP, and All UDP exist as rules, and make sure they each have "All IPv4" and "All IPv6" in their "Destinations" fields.
Under "Apply to Droplets", start typing the hostname of your droplet and select it from the list when it pops up.
Finally, hit the "Create Firewall" button to save the firewall and apply it to your instance. Now, traffic on other ports will not be allowed through, and your box is slightly more secure. I mean, I wouldn't go around bragging about it, this is super basic security. But at least it won't ever listen to traffic on other ports if someone happens to install malicious server software on the box.
Next, you'll configure domain name records so you can access your box with a nice internet address instead of a bunch of mean-looking numbers.
Create Domain Name Records
This section has information on moving a domain name over to DigitalOcean for use with your droplets and then using DigitalOcean to assign a subdomain to your droplet. If you don't yet own a domain name, head over to Namecheap or some other registrar to pick one up. They run from about $10 to $30 per year depending on the ending; .com's are about $11 per year. If you will not be setting up a domain name or you already have one set up, feel free to skip down to Basic Server Setup to start administrating your server immediately.
Once you have a domain name purchased, you will need to transfer it to DigitalOcean. They already have a great guide written up for how to do this, so head over there and complete the steps there.
Once the nameservers have been properly updated, head over to the Networking tab of the DigitalOcean control panel. You should see your domain name in the list there; if you don't, go ahead and add the raw (without anything before it, including www) domain name. For example, if I were to own the domain example.com. I would enter that exactly. Don't actually use example.com, use whatever domain name you own.
Next, you will add some DNS records to point at your server. Click on your domain in the list and you should see the "Create New Record" interface. Go to the "A" tab to create a new A-record; this will point the domain name to your droplet's IPv4 address.
You'll be using a subdomain, which is the part in the address that comes before the domain you purchased. For example, in the address www.example.com, example.com would be the domain name and www would be the subdomain. Enter something memorable; it usually makes sense to just call it the same as whatever hostname you assigned to the droplet during creation. Enter the subdomain in the "Hostname" field (for the instance I created during this guide, I would use meiling as the subdomain).
In the "Will Direct To" box, select the droplet that you created. In the "TTL" field, put down a number that makes sense. This number is how often the DNS network will check for changes in the record, and will affect how long it takes to update should you ever change what the record points to. 3600 seconds is one hour, and is perfectly sufficient.
Finally, hit the "Create Record" button and you are done! If you enabled IPv6 for your droplet, you should also create an AAAA-record going to the "AAAA" tab and repeating the process with the same information.
That's it! Your instance is now accessible by a human-readable internet address rather than a spoopy scary-skeletons set of numbers. But, note that you won't get anything yet if you try to go there in a web browser; you still need to set up the server.
Grab your root password from your email, pull up a terminal (or PuTTY if you are on Windows), and SSH to root@your-internet-address-that-you-just-set-up, and you'll be in business! If all has gone well, you'll be presented with a terminal prompt on your new box, and will be required to immediately change the root password. Please do so, but note that this will not be your main user if you follow the rest of the guide.
Now it's time to move on to setting up the server.
Basic Server Setup
So, now you've got a box somewhere on the internet. Awesome! The next step is to log in to it and start configuring everything. Before you jump to the metrics stack, you'll need to do some basic server setup.
If you've been following the guide so far, you won't yet have any users set up, so log into your instance as the user 'root' (root@your-box-address).
Install Basic Utilities
First, as soon as you're logged in, make sure all of the existing software is up to date. If your instance's distro is Ubuntu or another Debian-like, follow the instructions in this guide; otherwise, do whatever the equivalent for your distro is. If your instance is running on a non-Linux OS, god help you.
Install updates to the package lists:
root@meiling:~# apt-get update
Now install any available updates:
root@meiling:~# apt-get upgrade
Type Y if required to continue with the install.
If there were messages during the update about packages that are no longer required, you can remove them after the update completes:
root@meiling:~# apt-get autoremove
Next, you'll install some programs that will make life easier on this system.
If you do not have sudo on your system, install it now. You can test whether you have sudo by trying to use it. If you don't have it, you will see the following:
sudo: command not found
If you don't have it, go ahead and install it now.
root@meiling:~# apt-get install sudo
Next, you'll want a text editor. For simplicity's sake, this guide will use the nano editor, but if you prefer, you can install vim, emacs, or any other editor.
root@meiling:~# apt-get install nano
In all likelihood, it will already be installed.
That's it for initial software and set up! If you would like, I'd also recommend installing screen or tmux so you can keep your session open even if you lose your connection while you are SSH'd into your box, but it is by no means necessary. Next, you'll move on to creating a user for yourself.
Create Users and Groups
Right now, you are logged into your system as the root user. This is generally not a good idea, because the root user is unrestricted and if it were compromised, the attacker would have full system access. You really only need to be logged in as root in special circumstances; for general use, you'll want to create a new user for yourself on your box that can only perform restricted, 'regular' actions. You'll also set it up so the user can elevate its permissions temporarily as needed with the sudo command.
First, create the new user for yourself. For the username, pick something that is easy to remember. It doesn't have to be secret; for me personally, I just use dekarrin. Another common method of creating usernames is just your initials; for me, this would be rcn, for Richard Stallman, it would be rms. No matter what, unless you want your life to be difficult, make sure it's all lowercase and has no punctuation. Go ahead and create the user:
root@meiling:~# adduser dekarrin
You will prompted to set a password for the new user. SET IT TO SOMETHING OTHER THAN THE ROOT PASSWORD. If you don't, setting up the additional user is completely pointless.
You may be prompted for additional information on the new user; feel free to fill it in as you wish or just leave fields blank and hit enter.
Once you are done, confirm that the new user exists by running the id command. You should see something along the lines of the following:
root@meiling:~# id dekarrin uid=1000(dekarrin) gid=1000(dekarrin) groups=1000(dekarrin)
If you see id: 'dekarrin': no such user, then the user has not been set up properly, and you'll need to try again.
Next, add your user to the supplementary group sudo to allow it to run the sudo command. The sudo command is used for performing privileged action as an unprivileged user; it is very necessary unless you want to be switching to the root user every time you need to do system config.
root@meiling:~# usermod -a -G sudo dekarrin
Confirm that the change worked by running id and making sure that sudo appears in the groups that the user is a member of.
root@meiling:~# id dekarrin uid=1000(dekarrin) gid=1000(dekarrin) groups=1000(dekarrin),27(sudo)
Now, you need to make sure that the sudo group is authorized to execute sudo. This will be in the sudoers configuration file. The exact location may vary by distro, but that file should not be modified directly anyways. Instead, you will use the visudo command, which will allow us to edit the config with nano, and once you are done, it will make sure that the edited contents are valid before using it.
root@meiling:~# visudo
Scroll through the file using the arrow keys, and make sure that the line %sudo ALL=(ALL:ALL) ALL exists somewhere in the file.
If it exists, but has a hash character in front of it (#), remove the hash character. If the line does not exist, scroll to the bottom of the file and add it.
When done, use the keyboard command given on the bottom of the screen to 'Write-out' (save) the file. The ^ character in the shortcuts refers to the 'Control' key. The command for writing out in nano is ^O (Control-O). Hit it and you will then be prompted to give a name for the file. Leave it as the default and hit enter, then do ^X to exit from nano.
Now, your new user is set up and can use sudo. Log out of the instance with exit, and log back in as your new user ("yournewuser@yourserver").
root@meiling:~# exit logout Connection to meiling.example.com closed. [dekarrin@kousakakirino 09:27:43 ~]$ ssh dekarrin@meiling.example.com dekarrin@meiling.example.com's password: … dekarrin@meiling:~$
Double-check that sudo is working properly with a test command:
dekarrin@meiling:~$ sudo echo test [sudo] password for dekarrin: test dekarrin@meiling:~$
Depending on the distro, it's possible that the first time you use sudo, you will be presented with a prompt that asks you to accept the responsibility of being able to use the sudo command. That's fine, accept the prompt.From now on, it is a good idea to never log in as the root user except in emergencies. For any further steps for the rest of this guide, make sure to be logged in as your new user, not as the root user.
One last thing is required before all the users and groups are set up. For the SSL/TLS certificates on your server, you will want to create a group that will own them so that root is not the only one able to access/use them.
dekarrin@meiling:~$ sudo groupadd ssl-cert
Now you are done with user/group set up and can move on to getting your SSL certificates set up.
Obtain a TLS Certificate with Let's Encrypt
In order to authenticate your server to the internet, as well as encrypt your metrics and dashboard traffic, you will want to use TLS certificate encryption. SSL/TLS certificates are most commonly known for being the method by which HTTPS operates, but they are used in a variety of other environments as well.
Let's Encrypt is a Certificate Authority that can be used to obtain a TLS certificate free-of-charge. This is an exciting development in making the internet a more secure place; in the past, public Certificate Authorities were mainly government and regulatory bodies, and all of them charged a fee for processing certificate applications and renewals.
First, you need to install Certbot, which will automate the renewal and request process for certificates. Add the Certbot Ubuntu PPA to APT's packages:
dekarrin@meiling:~$ sudo apt-add-repository ppa:certbot/certbot [sudo] password for dekarrin: This is the PPA for packages prepared by Debian Let's Encrypt Team and backported for Ubuntu(s). More info: https://launchpad.net/~certbot/+archive/ubuntu/certbot Press [ENTER] to continue or ctrl-c to cancel adding it gpg: keyring `/tmp/tmpy6_m4x5_/secring.gpg' created gpg: keyring `/tmp/tmpy6_m4x5_/pubring.gpg' created gpg: requesting key 75BCA694 from hkp server keyserver.ubuntu.com gpg: /tmp/tmpy6_m4x5_/trustdb.gpg: trustdb created gpg: key 75BCA694: public key "Launchpad PPA for certbot" imported gpg: Total number processed: 1 gpg: imported: 1 (RSA: 1) OK
Then, update the package list.
dekarrin@meiling:~$ sudo apt-get update Hit:1 https://repos.sonar.digitalocean.com/apt main InRelease Get:2 http://security.ubuntu.com/ubuntu xenial-security InRelease [102 kB] Hit:3 http://nyc2.mirrors.digitalocean.com/ubuntu xenial InRelease Get:4 http://ppa.launchpad.net/certbot/certbot/ubuntu xenial InRelease [24.3 kB] Get:5 http://nyc2.mirrors.digitalocean.com/ubuntu xenial-updates InRelease [102 kB] Get:6 http://nyc2.mirrors.digitalocean.com/ubuntu xenial-backports InRelease [102 kB] Get:7 http://nyc2.mirrors.digitalocean.com/ubuntu xenial-updates/main amd64 Packages [724 kB] Get:8 http://nyc2.mirrors.digitalocean.com/ubuntu xenial-updates/universe amd64 Packages [588 kB] Get:9 http://ppa.launchpad.net/certbot/certbot/ubuntu xenial/main amd64 Packages [14.9 kB] Get:10 http://ppa.launchpad.net/certbot/certbot/ubuntu xenial/main Translation-en [9,252 B] Fetched 1,667 kB in 0s (1,844 kB/s) Reading package lists... Done
And then install Certbot.
dekarrin@meiling:~$ sudo apt-get install certbot
Now execute Certbot, and use it to request a certificate from Let's Encrypt. Replace the domain at the end of the following command with the full domain that you have set up for your instance:
dekarrin@meiling:~$ sudo certbot certonly --standalone --preferred-challenges http -d meiling.example.com
Enter an email address when prompted and answer the other prompts appropriately. The challenge server will run, and when it is completed you will see a message indicating that your certificates have been set up.
Next, you will need to add a script that will properly set the permissions on the certificates after renewal has completed. Open a new file in the renewal hooks section of the local Let's Encrypt environment:
dekarrin@meiling:~$ sudo nano /etc/letsencrypt/renewal-hooks/deploy/set-cert-permissions.sh
Then copy the following content into the file:
#!/bin/sh if [ "$(id -u)" -ne 0 ] then "Must be run as root" >&2 exit 1 fi chgrp ssl-cert /etc/letsencrypt/live chgrp -R ssl-cert /etc/letsencrypt/archive chmod 750 /etc/letsencrypt/live chmod 750 /etc/letsencrypt/archive chgrp ssl-cert "$RENEWED_LINEAGE" chmod 750 "$RENEWED_LINEAGE" for x in $(ls "$RENEWED_LINEAGE") do chgrp ssl-cert "$RENEWED_LINEAGE/$x" chmod 654 "$RENEWED_LINEAGE/$x" done #systemctl restart influxdb #systemctl restart grafana-server
Once you are done setting up the components of your server, you will go back and uncomment them in the file, but for now, keep them commented.
Give the script execution permission so that Certbot can run it.
dekarrin@meiling:~$ sudo chmod 744 /etc/letsencrypt/renewal-hooks/deploy/set-cert-permissions.sh
Now that the script is in place, run certbot again and force renewal of your certificates so the deploy script has a chance to run.
dekarrin@meiling:~$ sudo certbot renew --force-renew
And that's it! The certificates are now ready to go, and you can start setting up the components of the metrics server.
Setting Up InfluxDB
InfluxDB is the storage backend that you will be using to store metrics on. It is a NoSQL database that has a time-series structure which makes it suitable for storing metrics very efficiently.
Install InfluxDB
First, add the InfluxData repository to APT.
dekarrin@meiling:~$ sudo su root@meiling:/home/dekarrin# curl -sL https://repos.influxdata.com/influxdb.key | sudo apt-key add - root@meiling:/home/dekarrin# source /etc/lsb-release root@meiling:/home/dekarrin# echo "deb https://repos.influxdata.com/${DISTRIB_ID,,} ${DISTRIB_CODENAME} stable" | sudo tee /etc/apt/sources.list.d/influxdb.list root@meiling:/home/dekarrin# exit
Next, update the package lists.
dekarrin@meiling:~$ sudo apt-get update
And then install InfluxDB.
dekarrin@meiling:~$ sudo apt-get install influxdb
Before starting up InfluxDB, you need to modify the configuration settings. Open the config file as root:
dekarrin@meiling:~$ sudo nano /etc/influxdb/influxdb.conf
Go to the [retention] section and set enabled to true and set check-interval to "30m". This will enable rentention policies in InfluxDB, which allow you to set how long data persists before being deleted. This section of config does not actually set any retention policies; it just makes it so you can use them.
[retention] # Determines whether retention policy enforcement enabled. enabled = true # The interval of time when retention policy enforcement checks run. check-interval = "30m"
Under the [http] section, uncomment and set the variables to the values listed. This will enable using InfluxDB over HTTP.
[http] # Determines whether HTTP endpoint is enabled. enabled = true # The bind address used by the HTTP service. bind-address = ":8086" # Determines whether user authentication is enabled over HTTP/HTTPS. auth-enabled = true # The default realm sent back when issuing a basic auth challenge. realm = "InfluxDB"
Also in the [http] section, uncomment and set the variables to the correct values to enable HTTPS encryption/authentication. Be sure to change the domain name in the examples to match your instance's domain name.
# Determines whether HTTPS is enabled. https-enabled = true # The SSL certificate to use when HTTPS is enabled. https-certificate = "/etc/letsencrypt/live/meiling.example.com/fullchain.pem" # Use a separate private key location. https-private-key = "/etc/letsencrypt/live/meiling.example.com/privkey.pem"
In the [subscriber] section, uncomment and set enabled to false. The subscription settings are used by Kapacitor, a front-end offering from InfluxData. Since this guide does not use Kapacitor, it is better to disable subscribers entirely in order to eliminate the overhead.
[subscriber] # Determines whether the subscriber service is enabled. enabled = false
All other values can be left to their defualts.
Next, add the influxdb user to the ssl-cert group in order to give it access to the SSL/TLS certificates.
dekarrin@meiling:~$ sudo usermod -a -G ssl-cert influxdb
Finally, start InfluxDB.
dekarrin@meiling:~$ sudo systemctl start influxdb
Make sure InfluxDB started successfully. You should see Active: active (running) somewhere in the output:
dekarrin@meiling:~$ systemctl status influxdb ● influxdb.service - InfluxDB is an open-source, distributed, time series database Loaded: loaded (/lib/systemd/system/influxdb.service; enabled; vendor preset: enabled) Active: active (running) since Sat 2018-02-17 21:05:11 UTC; 2min 12s ago
Now that InfluxDB is running, edit the deploy script for Let's Encrypt and uncomment the line that restarts InfluxDB:
dekarrin@meiling:~$ sudo nano /etc/letsencrypt/renewal-hooks/deploy/set-cert-permissions.sh
chmod 654 "$RENEWED_LINEAGE/$x" done systemctl restart influxdb #systemctl restart grafana-server
Set Up Database and InfluxDB Users
Now that InfluxDB has been installed and started, you will need to connect to it and set up the databases and users.
Connect to InfluxDB with the influx command. HTTPS is always enabled (as per the config setup in this guide), so you will need to use the -ssl option when connecting, and you will need to specify the host with the -host flag.
dekarrin@meiling:~$ influx -ssl -host meiling.example.com Connected to https://meiling.example.com:8086 version 1.4.2 InfluxDB shell version: 1.4.2
Since this is your first time connecting, you'll need to set up the admin user. Make a strong password and do not lose it; it is required for access to the database.
> CREATE USER admin WITH PASSWORD 'agoodpassword' WITH ALL PRIVILEGES;
Now disconnect from the database and reconnect as the admin user:
> exit dekarrin@meiling:~$ influx -ssl -host meiling.example.com -username admin -password agoodpassword Connected to https://meiling.example.com:8086 version 1.4.2 InfluxDB shell version: 1.4.2 >
Next, create the databases for metrics. This tutorial will guide you in creating three databases; one for the health of the global hath network, one for the hath network health of your clients, and one for the hardware/system metrics of your clients.
> CREATE DATABASE hath_network; > CREATE DATABASE hath_client_network_health; > CREATE DATABASE hath_client_metrics;
Next, create the users and grant them permissions on the databases they need. This tutorial will guide you in creating three users; one for reporting metrics from Telegraf installed on clients, one for reporting metrics from Telegraf installed on the metrics server, and one for Grafana to read metrics on all databases. Make sure to give them real passwords, and not the exact passwords shown here.
> CREATE USER "hath_client_telegraf" WITH PASSWORD 'clientpass'; > CREATE USER "hath_netstats" WITH PASSWORD 'netstatspass'; > CREATE USER "grafana" WITH PASSWORD 'grafanapass';
Grant the correct permissions to each user for the corresponding database(s):
> GRANT WRITE ON hath_network TO hath_netstats; > GRANT WRITE ON hath_client_network_health TO hath_netstats; > GRANT WRITE ON hath_client_metrics TO hath_client_telegraf; > GRANT READ ON hath_network TO grafana; > GRANT READ ON hath_client_network_health TO grafana; > GRANT READ ON hath_client_metrics TO grafana;
The last thing to do is to set up retention policies for data, if desired. This will give all data a time-to-live before it is automatically purged from the database. Setting up retention policies is beyond the scope of this guide, but if you wish to set them up, see the info at the InfluxData website.
At this point, all users and databases should now be set up on the InfluxDB server. Your metrics server is now ready to start receiving data!
Setting Up Telegraf on the Clients
Telegraf is a program that collects system metrics and forwards them to a data backend. In this section of the guide, you will set up Telegraf on your H@H clients.
First, install Telegraf. Go to the guide on InfluxData and follow the instructions specific to the system that the hath client is installed on.
Then, take the sample configuration file and copy its contents to the telegraf configuration file. On Debian-like Linux distros, this will be at /etc/telegraf/telegraf.conf.
Edit the configuration file section [[outputs.influxdb]]. Set the url in the urls option to point to your server (note that you must include the port number at the end, as well as the https at the beginning), and update the password option to be what you set the password of hath_client_telegraf to.
Edit the configuration file section [agent]. Set the hostname option to a unique value on each hath client. For example, I gave my hath client the hostname "flandre", which will appear in the dashboard data once Grafana is set up. If you have more than one hath client, make sure this is set to a different value on each one.
Start/Restart the Telegraf service. On Debian-like distros, this is done with sudo systemctl restart telegraf. On other systems, consult the Telegraf documentation to find out how to start the service.
Confirm that Telegraf is running. On Debian-like distros, this is done with sudo systemctl status telegraf.
If all has gone well, Telegraf should now be running on the hath system.
Setting Up Telegraf on the Metrics Server
In order to report statistics on the clients, such as hath-rate, files served, client trust, and client quality, you need to set up a metrics collection script to scrape the Hentai@Home info page and relay the metrics to InfluxDB. This tutorial will use a custom python system called PyTelegrafHTTP to fetch the info, and then Telegraf will handle sending it to InfluxDB.
It's important that this system be set up on a server that is separate from all of your hath clients. This tutorial will assume that you are setting it up on the metrics server, so go ahead and log into that box.
Install Telegraf
First, add the repository to the package manager:
dekarrin@meiling:~$ sudo su root@meiling:/home/dekarrin# curl -sL https://repos.influxdata.com/influxdb.key | sudo apt-key add - root@meiling:/home/dekarrin# source /etc/lsb-release root@meiling:/home/dekarrin# echo "deb https://repos.influxdata.com/${DISTRIB_ID,,} ${DISTRIB_CODENAME} stable" | sudo tee /etc/apt/sources.list.d/influxdb.list root@meiling:/home/dekarrin# exit
Then, update the package list:
dekarrin@meiling:~$ sudo apt-get update
And then install Telegraf:
dekarrin@meiling:~$ sudo apt-get install telegraf
Next, take the contents of the sample server telegraf config file and copy the contents to /etc/telegraf/telegraf.conf.
Edit the config file and make sure to set both urls properties to point at your server; make sure to keep the port number and the https in the URL. Also update both password properties and set them to the password of the hath_netstats user.
Start up Telegraf (with restart to ensure configuration is loaded) and check that it started properly:
dekarrin@meiling:~$ sudo systemctl restart telegraf dekarrin@meiling:~$ systemctl status telegraf ● telegraf.service - The plugin-driven server agent for reporting metrics into InfluxDB Loaded: loaded (/lib/systemd/system/telegraf.service; enabled; vendor preset: enabled) Active: active (running) since Sat 2018-02-17 22:48:36 UTC; 15min ago
Telegraf has now been installed; now you need to install the scraper tool to get the metrics from the E-Hentai server.
Install PyTelegrafHTTP
PyTelegrafHTTP is a custom tool that I wrote in order to scrape data from arbitrary websites and send them to Telegraf. It only has an install script for a Debian-like environment; other environments will need to have it installed manually.
First, install git so you can download the latest version of PyTelegrafHTTP:
dekarrin@meiling:~$ sudo apt-get install git
PyTelegrafHTTP requires python3, so install it now:
dekarrin@meiling:~$ sudo apt-get install python3
The last dependency for installing PyTelegrafHTTP is pip; install that as well:
dekarrin@meiling:~$ sudo apt-get install python3-pip
Now pull the PyTelegrafHTTP repository:
dekarrin@meiling:~$ git clone https://github.com/dekarrin/pytelegrafhttp.git
Change directory to the repository folder, and execute the install script for Debian/Ubuntu systems. If you are not on a Debian/Ubuntu system, you will need to find an alternative way of setting up the file. Otherwise, go ahead and execute the script. The parameter at the end is the user to install the script as, which at the time, must be the root user:
dekarrin@meiling:~$ cd pytelegrafhttp dekarrin@meiling:~/pytelegrafhttp$ sudo scripts/install.sh root ... main config located in '/etc/pytelegrafhttp/config.py' Unit file symlinked as 'pytelegrafhttp.service'. To start, do `systemctl start pytelegrafhttp`
Now you will need to edit the config file for PyTelegrafHTTP. An explanation of the config file format is far beyond the scope of this guide; it is a normal python module, but the variables themselves are moderately complex. Instead, copy the contents of the example PyTelegrafHTTP config into the real config file at /etc/pytelegrafhttp/config.py.
dekarrin@meiling:~$ sudo nano /etc/pytelegrafhttp/config.py
Make sure to update the scraper_username and scraper_password variables with your actual E-hentai credentials. Because these are stored in this file, make sure that the permissions on the file are such that only root and the pytelegrafhttp user can read it.
Once the config file is updated, start PyTelegrafHTTP:
dekarrin@meiling:~$ sudo systemctl start pytelegrafhttp
Give it about 60 seconds to log in, and then verify that is running:
dekarrin@meiling:/etc/pytelegrafhttp$ sudo systemctl status pytelegrafhttp ● pytelegrafhttp.service - Pytelegrafhttp is a scraper for metrics from HTTP pages Loaded: loaded (/etc/pytelegrafhttp/pytelegrafhttp.service; linked; vendor preset: enabled) Active: active (running) since Sat 2018-02-17 23:51:48 UTC; 55s ago Docs: https://github.com/dekarrin/pytelegrafhttp/ Main PID: 8168 (pytelhttp) Tasks: 1 Memory: 34.1M CPU: 846ms CGroup: /system.slice/pytelegrafhttp.service └─8168 /usr/bin/python3 /usr/local/bin/pytelhttp start --config /etc/pytelegrafhttp/config.py Feb 17 23:52:02 meiling /usr/local/bin/pytelhttp[8168]: Headers: {'User-Agent': 'Mozilla/5.0', 'Accept-En Feb 17 23:52:02 meiling /usr/local/bin/pytelhttp[8168]: Body: None Feb 17 23:52:02 meiling /usr/local/bin/pytelhttp[8168]: Received response: HTTP 200 Feb 17 23:52:02 meiling /usr/local/bin/pytelhttp[8168]: Headers: {'X-Varnish': '221597470', 'Content-Leng Feb 17 23:52:02 meiling /usr/local/bin/pytelhttp[8168]: Body: b'<!DOCTYPE html PUBLIC "-//W3C//DTD XHTML Feb 17 23:52:03 meiling /usr/local/bin/pytelhttp[8168]: metric 5 (hath_health) for endpoint + '/hentaiath Feb 17 23:52:03 meiling pytelhttp[8168]: WARNING: metric 5 (hath_health) for endpoint + '/hentaiathome.ph Feb 17 23:52:03 meiling /usr/local/bin/pytelhttp[8168]: Got metrics for /hentaiathome.php; sending... Feb 17 23:52:03 meiling pytelhttp[8168]: Got metrics for /hentaiathome.php; sending... Feb 17 23:52:03 meiling /usr/local/bin/pytelhttp[8168]: Sleep for 119.28270 seconds
Security notice: even though great care is taken to set the permissions properly on the config file, your password and username is exposed in it. If your server is compromised, your e-hentai account will be compromised as well. Be aware of your server status, and if it is compromised, take steps to fix it quickly. For maximum security, you can edit the config file after PyTelegrafHTTP has already started and remove your account password, but be aware that you will need to re-add it if PyTelegrafHTTP is ever restarted, and that PyTelegrafHTTP will no longer be able to automatically start itself if your instance is restarted.
Now that PyTelegrafHTTP is installed, you'll want to double-check that Telegraf is properly relaying the metrics from it. Wait about 2 minutes and check the status of Telegraf once again. Use sudo to make sure you can see the journal log as well.
dekarrin@meiling:~$ sudo systemctl status telegraf
It should look very similar to the status it had right after it started, since Telegraf does not log regular behavior. If you see errors such as Error writing to output [influxdb]: Could not write to any InfluxDB server in cluster, it's possible your configuration changes were not picked up. In this case, restarting the service should cause the configuration to be reloaded:
dekarrin@meiling:~$ sudo systemctl restart telegraf
And then try checking the status again after another 2 minutes.
If everything is good up to this point, the PyTelegrafHTTP daemon is now installed and is relaying metrics via Telegraf.
Setting Up Grafana
Now you've got multiple data sources feeding into a high-performance storage backend. Next up is getting a way to view all that data. Grafana is a front-end application designed to work with metrics storage systems. It can display graphs, charts, and metric data in easy-to-read dashboards.
Install Grafana
Add the repository PPA to the package manager:
dekarrin@meiling:~$ sudo su root@meiling:/home/dekarrin# echo "deb https://packagecloud.io/grafana/stable/debian/ jessie main" >> /etc/apt/sources.list root@meiling:/home/dekarrin# curl https://packagecloud.io/gpg.key | sudo apt-key add - root@meiling:/home/dekarrin# exit
Next, update the package lists:
dekarrin@meiling:~$ sudo apt-get update
And install Grafana:
dekarrin@meiling:~$ sudo apt-get install grafana
Next, you need to do some basic config of the Grafana server. Most of the set up can be done via the web UI, but you'll want to set up server connection security first. Go ahead and open the Grafana configuration file:
dekarrin@meiling:~$ sudo nano /etc/grafana/grafana.ini
In the [server] section, uncomment and set the variables protocol to https, http_port to 443, cert_file to /etc/letsencrypt/live/meiling.example.com/fullchain.pem, and cert_key to /etc/letsencrypt/live/meiling.example.com/privkey.pem, making sure to replace the domain names with your instance's actual domain name. This will enable HTTPS for Grafana, and will tell it to only use HTTPS to serve content.
[server] # Protocol (http, https, socket) protocol = https # The ip address to bind to, empty will bind to all interfaces ;http_addr = # The http port to use http_port = 443 ... # https certs & key file cert_file = /etc/letsencrypt/live/meiling.dekarrin.com/fullchain.pem cert_key = /etc/letsencrypt/live/meiling.dekarrin.com/privkey.pem
In the [security] section, uncomment and set secret_key to a random 20-character string of mixed-case letters and numbers. This will add an additional layer of security by changing the cookie signing key from the default.
[security] # default admin user, created on startup ;admin_user = admin # default admin password, can be changed before first start of grafana, or in profile settings ;admin_password = admin # used for signing secret_key = tHe20CharacterStrINg
That's it for file-based configuration. Next, add the Grafana user to the ssl-cert group so it's able to access the SSL/TLS certificates:
dekarrin@meiling:~$ sudo usermod -a -G ssl-cert grafana
Additionally, the typical Grafana install process does not grant Grafana permission to bind to ports lower than 1000. Since it will be using port 443, you will need to grant it that permission manually:
dekarrin@meiling:~$ sudo setcap 'cap_net_bind_service=+ep' /usr/sbin/grafana-server
Next, you need to start the grafana service. Tell systemd to reload daemons:
dekarrin@meiling:~$ sudo systemctl daemon-reload
And then tell it to start the grafana service:
dekarrin@meiling:~$ sudo systemctl start grafana-server
Check on its status, and make sure it is active:
dekarrin@meiling:~$ sudo systemctl status grafana-server ● grafana-server.service - Grafana instance Loaded: loaded (/usr/lib/systemd/system/grafana-server.service; disabled; vendor preset: enabled) Active: active (running) since Sun 2018-02-18 16:43:28 UTC; 4s ago
Next, enable the Grafana service so that it will automatically start at boot:
dekarrin@meiling:~$ sudo systemctl enable grafana-server.service
Finally, uncomment Grafana's line in the lets-encrypt deploy script so it is restarted when certificates are renewed:
dekarrin@meiling:~$ sudo nano /etc/letsencrypt/renewal-hooks/deploy/set-cert-permissions.sh
chmod 654 "$RENEWED_LINEAGE/$x" done systemctl restart influxdb systemctl restart grafana-server
That's it. Assuming everything else ran properly, you should now be able to open up a web browser and navigate to your new Grafana instance, at 'https://your.domain.name'!
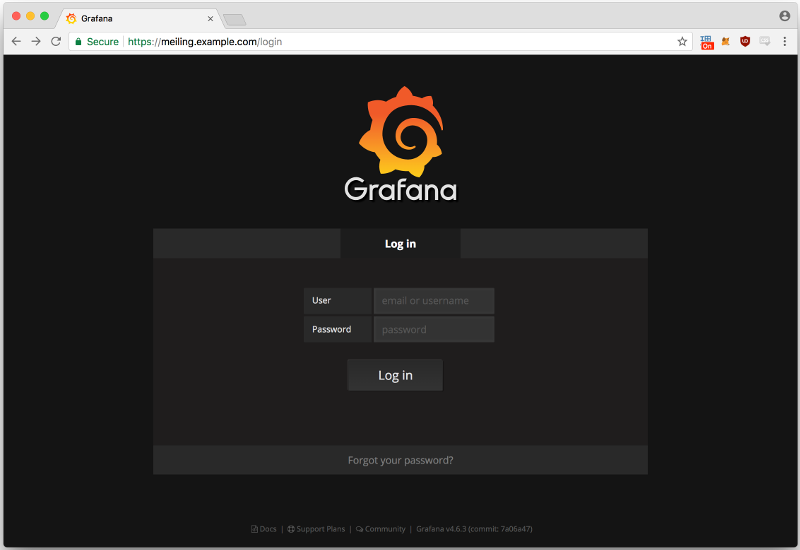
The default Grafana login page for a fresh install.
Finish Setup in Webapp
Now that your Grafana server is running, you'll need to set an admin password for the web interface and create your datasources. All of this can be done through the web interface, so head over to https://your.domain.address to start.
Log in with the default username admin and the default password admin. First, you will be changing the password. Go to your user profile.
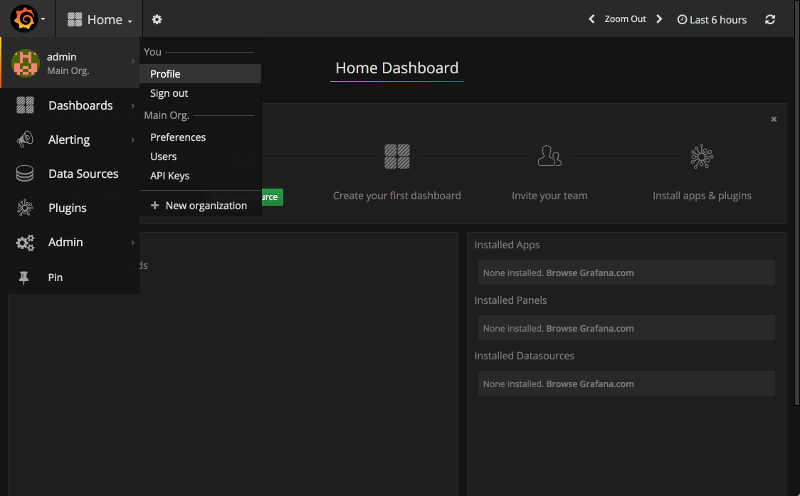
Grafana menu to get to profile.
Fill in the name and email fields and hit 'Update' in that section if you wish. Go to the "Change Password" section. Use the dialog to change the admin password to something better than admin. Make sure that this password is different from your instance login passwords, your InfluxDB user passwords, and your E-Hentai password.
Now use the menu in the upper-left hand to go to the "Data Sources" section of Grafana. Right now, there aren't any defined; you will need to add one for each of the three databases you defined when setting up InfluxDB.
Hit the "Add data source" button to start creating the first data source.
Set the Name to Hath Client Hardware Metrics. Check the box for this to be the default datasource. Change the Type dropdown to InfluxDB, and the rest of the fields should update to be InfluxDB-specific.
Under HTTP Settings, set the URL to your InfluxDB server, which in this guide is the same as the Grafana server but with the port number appended to the end. Set the Access type to proxy; direct is only necessary for a high-load Grafana instance.
Leave the HTTP Auth section blank, and skip down to InfluxDB Details. Set the database to hath_client_metrics, the username to grafana, and the password to the password for the InfluxDB user grafana.
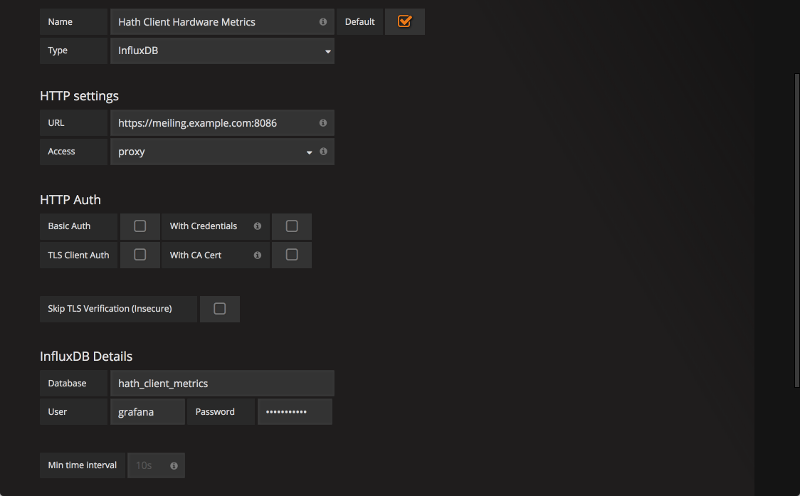
Settings for first Grafana data source.
Hit the "Add" button at the bottom, and you should see an indicator that tells you the datasource has been added and is currently working properly.
Go back to the Data Sources section of Grafana and repeat the process for the second data source. Do not check the Default box on this one. Use the name Hath Client Network Health and the database hath_client_network_health for this one, then add the new data source.
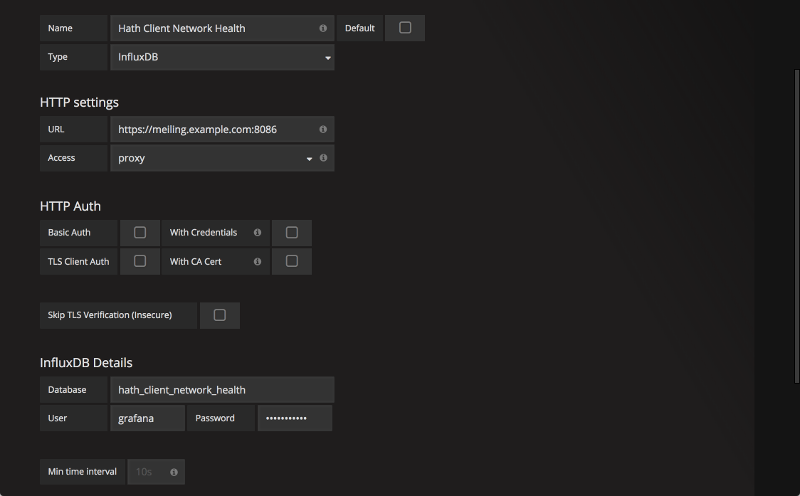
Settings for second Grafana data source.
Go back to the Data Sources section of Grafana and add one last data source for the third database. Again, keep the Default box unchecked. Use the name Hath Network and the database hath_network. Add the new data source.
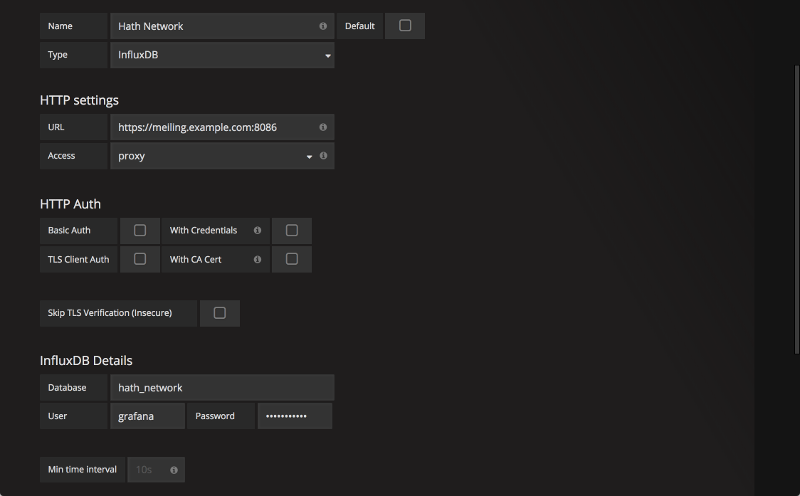
Settings for third Grafana data source.
Go back to the Data Sources section, and you should see all three of your data sources listed.
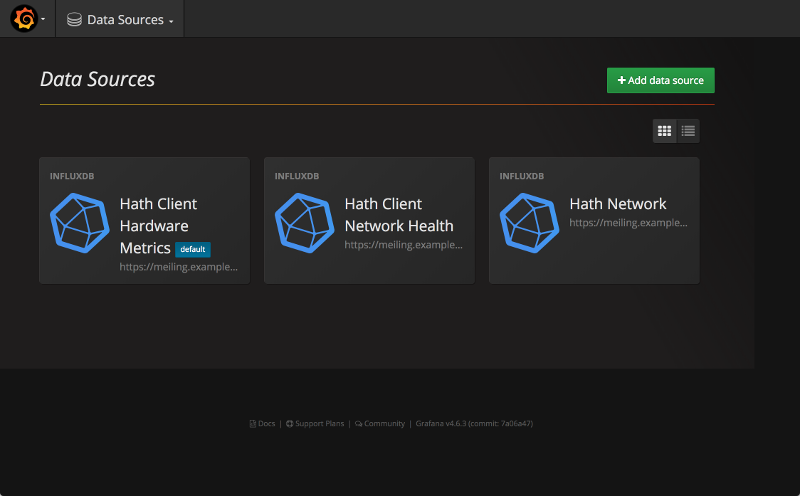
Three configured Grafana data sources.
Configuration of Grafana is now complete, and you can move on to create charts and dashboards.
Create Dashboards
Your metrics stack is now ready. You can now start building dashboards with Grafana. To make it easier to get started right away, I have made some pre-built dashboards available:
To import the dashboards, go to the menu and select "Import" under "Dashboards".
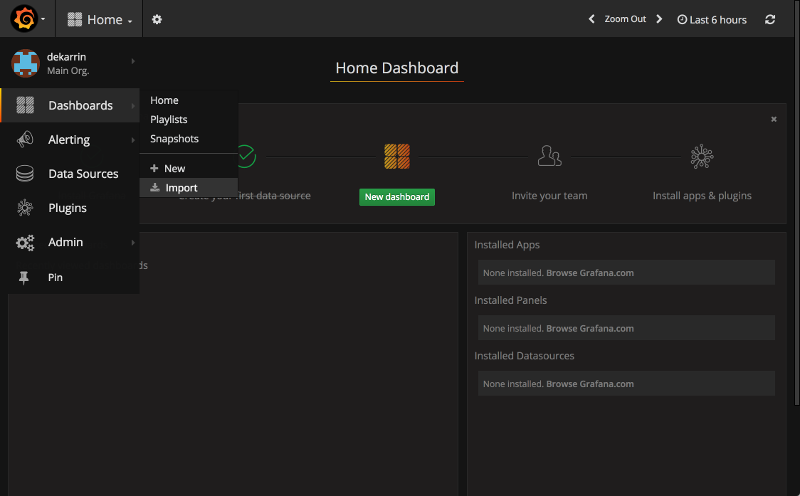
Location of "Import" in Grafana menu.
Copy the contents of one of the dashboard files listed above into the "Paste JSON" field of the import dialog, then hit the "Load" button. Press the "Import" button to complete the process.
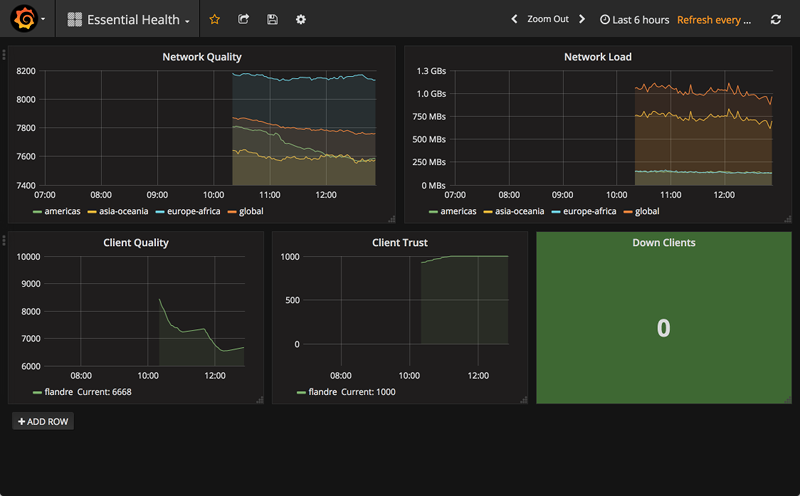
Example of imported dashboard.
You should see some data in the dashboard once it has been loaded. If you do not see any datapoints, something has gone wrong during the process, and you will need to fix your setup.
You may notice that the graphs are only partially filled with data. This is because not enough data has been collected for the time period that the dashboard is displaying in order to fill it. Don't worry, it will fill up eventually.
And, that's it! Repeat for any/all dashboards you want, and you'll have an initial set up. If you find any dashboard particularly useful, you can hit the star on the toolbar to "star" the dashboard, which puts it in the starred dashboard lists on the home page.
Note for multi-client setup: If you are monitoring multiple hath clients, you will need to edit some of the prefab panels to work properly. All of the singlestat "Down Clients" panels are optimized for only one client; to make them work with multiple clients, edit the panel and change the 'math' field in the SELECT query to be math(*-1 + total_clients), replacing total_clients with the number of clients you have.
Where To Go From Here
If you've been following this guide, you will now have a full suite of metrics and monitoring for your H@H clients. There are a few other things beyond the scope of this guide that it could be useful to pursue.
Alerting
Grafana can be set up to send out an Alert whenever a value on a panel passes a certain threshold. To set up an alert, go to any panel, click Edit, and go to the Alerts tab.
For more information on Alerting, see the guide by GrafanaLabs, which gives a full introduction to the alerting system.
Using IFTTT for Phone Notifications
If-This-Then-That (IFTTT) is a generic service for creating online mini-apps that react to certain actions. By creating a Grafana notification channel that POSTs to a Maker endpoint, IFTTT can receive the event and perform an action, such as alerting the phone app. IFTTT uses the WebHooks service to receive the events.
Actually getting the IFTTT service set up is beyond the scope of this guide, but hopefully this information is enough to get started with it.
Backups
If you did not yet set up automatic backups on your DigitalOcean instance, I very much recommend that you find some other method for doing so. If you don't back up your data, you are at risk for losing all of it.
The data in InfluxDB is the only information on the server that cannot be reproduced if the server gets trashed. Back up this data is the highest priority over everything else. For information on backing up InfluxDB, see the guide by InfluxData.